Regression-Based Financial Modeling and Forecasting
Objective: Determine whether a small, carefully‑chosen set of monthly macroeconomic variables can predict the next month’s direction (up vs. down) of the S&P 500, DJIA and NASDAQ.
Data & Pre-processing:
Time frame: 2000 – 2024, monthly frequency
Targets: Month‑over‑month returns for S&P 500, DJIA, NASDAQ (Yahoo Finance)
Candidate predictors (FRED): 2‑ & 10‑year Treasury yields, fed‑funds rate, CPI, unemployment, M2 money supply, NFCI, industrial production, UMich consumer sentiment, WTI oil prices, mortgage rates, OECD composite leading indicator
Resampled to monthly %, differenced for stationarity, one‑month lag added for NFCI
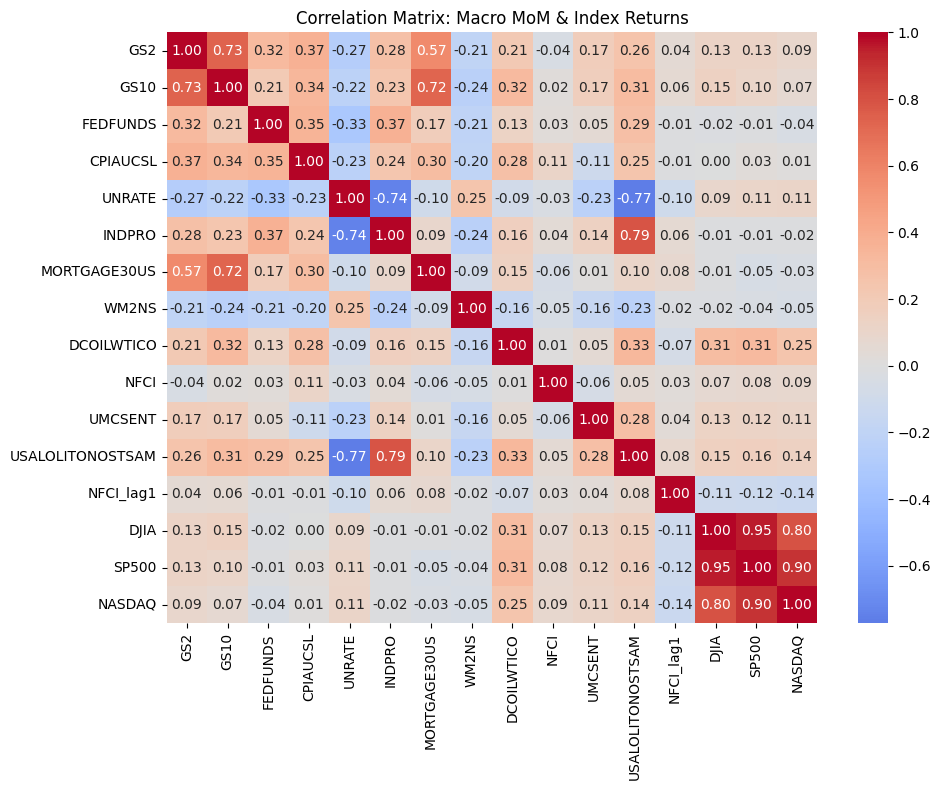
Five most informative features selected via Pearson correlation heat map:
Δ WTI oil price (DCOILWTICO)
Δ OECD composite leading indicator
Δ 2‑year Treasury yield (GS2)
Δ UMich consumer sentiment
NFCI (lag 1)
Modeling Path:
Regression trial (OLS, Lasso, Elastic‑Net, tree & gradient boosting):
Low explanatory power (R² ≈ 0.06–0.18). Oil prices dominated, generalization weak.
Pivot to classification: positive vs. negative next‑month return.
Logistic Regression and Random Forest trained on 2000–2017, tested on 2018–2023.
| Index | Model | Accuracy | Precision (Up) | Recall (Up) | F1 (Up) | Notes |
|---|---|---|---|---|---|---|
| S&P 500 | Logistic Regression | 65.3 % | 0.69 | 0.85 | 0.76 | Out‑performed buy‑and‑hold (2.14× vs. 1.78× ending capital). |
| S&P 500 | Random Forest | 65.3 % | 0.72 | 0.77 | 0.74 | Comparable accuracy, less interpretable. |
| DJIA | Logistic Regression | 59.7 % | 0.64 | 0.80 | 0.71 | Beat buy‑and‑hold (1.86× vs. 1.52×). |
| DJIA | Random Forest | 55.6 % | 0.65 | 0.59 | 0.62 | Under‑performed logistic on this index. |
| NASDAQ | Logistic Regression | 58.3 % | 0.68 | 0.68 | 0.68 | Slightly trailed buy‑and‑hold (2.05× vs. 2.17×). |
| NASDAQ | Random Forest | 59.7 % | 0.75 | 0.57 | 0.65 | Marginal accuracy gain but lower recall. |
Interpretation & Notes:
Even coarse macro data can give directional edge (~15 pp above chance) for broad‑market ETFs.
Oil‑price shocks and leading‑indicator shifts carry the strongest signal; consumer sentiment and short‑rate moves matter but lag.
Simple, transparent Logistic Regression yielded the best risk‑adjusted improvement and is easy to explain to stakeholders.
Limitations: monthly granularity misses intramonth events; structural breaks (e.g., 2008, COVID) challenge stationarity; bullish bias in 2018‑23 sample.
Key Figures: